

UTD CS Alumni Creates a Viral COVID-19 Visualization that Promotes Honest, Accessible, Transparent Access to Case Data

In mid-March with less than 2,000 confirmed cases of COVID-19 in the United States, UT-Dallas CS alumni Wade Fagen-Ulmschneider (BS’05, MS’06) had questions on the growth and spread of the soon-to-be pandemic. Over a period of two days, he brought together COVID-19 case data from Johns Hopkins University into a detailed visualization that provides readers the ability to dive into the raw data to answer their own questions. His visualization has gone viral, has been used in briefings by the governors of Kentucky and Washington state, and was named by The Verge as one of six best illustrations of COVID-19 data.
“I created a tool for myself to nerd out with the data. It has been humbling to get to nerd out with several million others over the past month,” said Wade Fagen-Ulmschneider, who earned his bachelor’s degree in software engineering and masters in computer science from Erik Jonsson School of Engineering and Computer Science. “One aspect that continues to make this visualization unique is that the interface is simple, transparent, honest, and accessible. Any reader can mouseover or tap on any data point to dive into the raw data and understand each day’s data.”
The visualization is part of a project by Fagen-Ulmschneider known as 91-DIVOC — created by reading COVID-19 backwards — and was inspired by his time at UT-Dallas. “Since being a comet and loving that our comet’s name is Temoc (comet read backwards), I have always had a fascination in reading words backwards to see if it makes any sense.” The 91-DIVOC project aims to explore 91 projects, data visualizations, or ideas to make the best of the COVID-19 pandemic.
Fagen-Ulmschneider’s first project, his viral COVID-19 visualization, was inspired by early works on visualizing the COVID-19 pandemic, including John Burn-Murdoch’s visualizations as part of his coverage of the pandemic for the Financial Times. When Fagen-Ulmschneider saw Burn-Murdoch’s work, he was left with more questions since the work was only a single image with no interactivity. As an Associate Professor of Computer Science at The University of Illinois at Urbana-Champaign, Fagen-Ulmschneider’s work with thousands of students has helped shape his creation of powerful visualizations. “Having built hundreds of visualizations with students over the years, I have had the privilege to work together with students in applying best practices in visualization to create amazing mobile and desktop-based interactive visualizations.”
Launched over a month ago, the 91-DIVOC visualization is updated every day with global COVID-19 data and has been viewed by over 2,000,000 users. “Each day, tens of thousands of users and I dive into the raw data and explore the visualization to understand the latest on COVID-19. I look forward to the day we can do this in real life.”
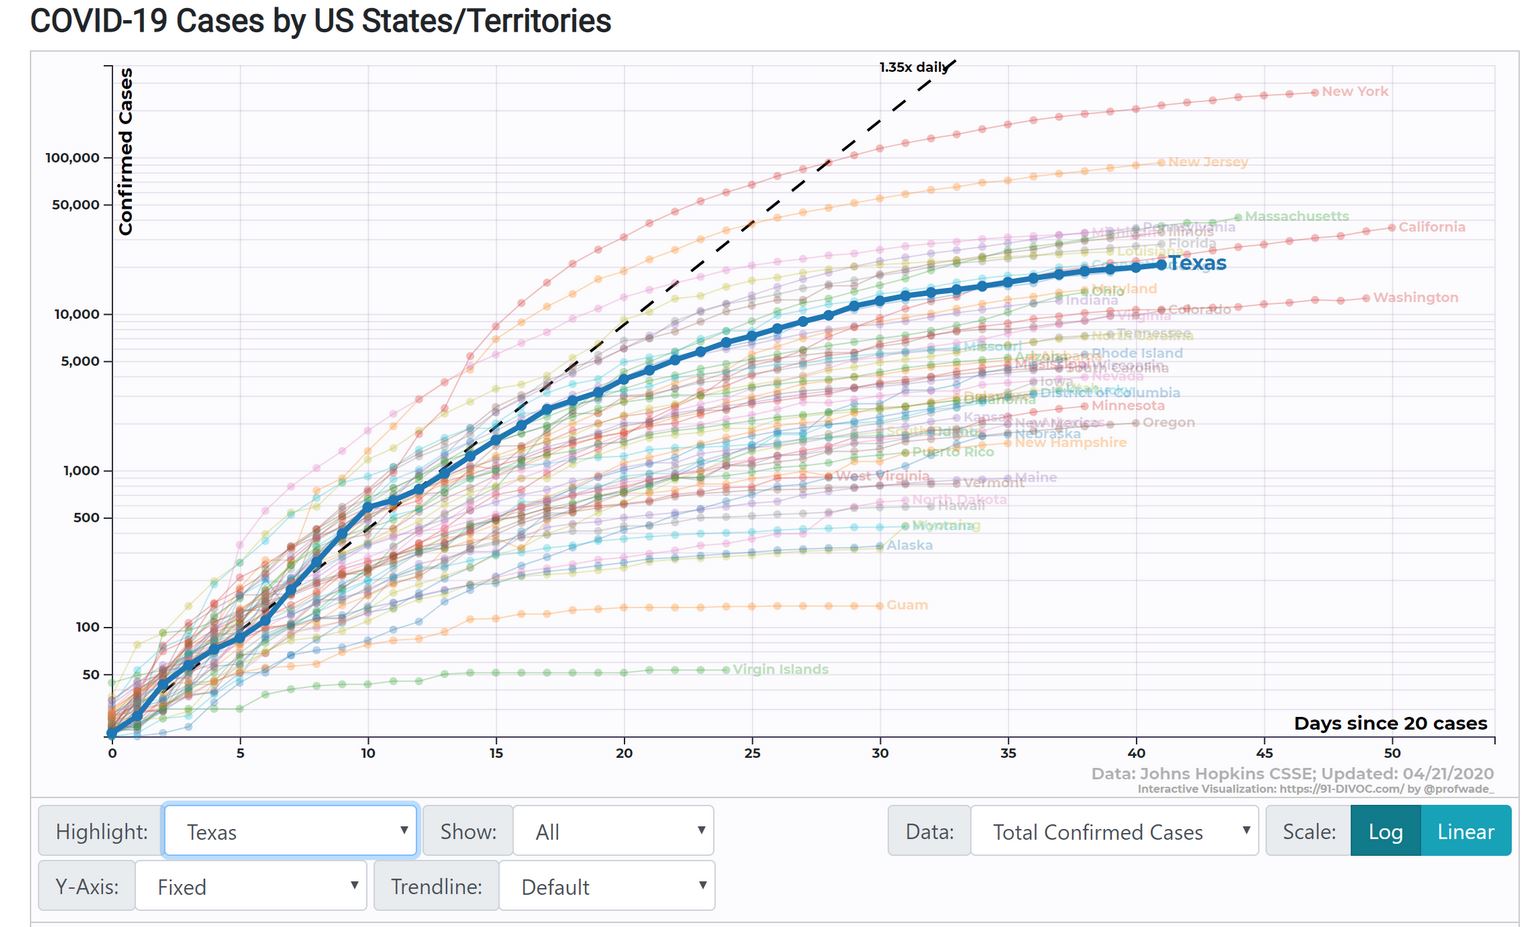
A screenshot of 91-DIVOC showing the history of total confirmed cases as of April 21, 2020 in each US state, with the state of Texas highlighted among all of the US states and territories.
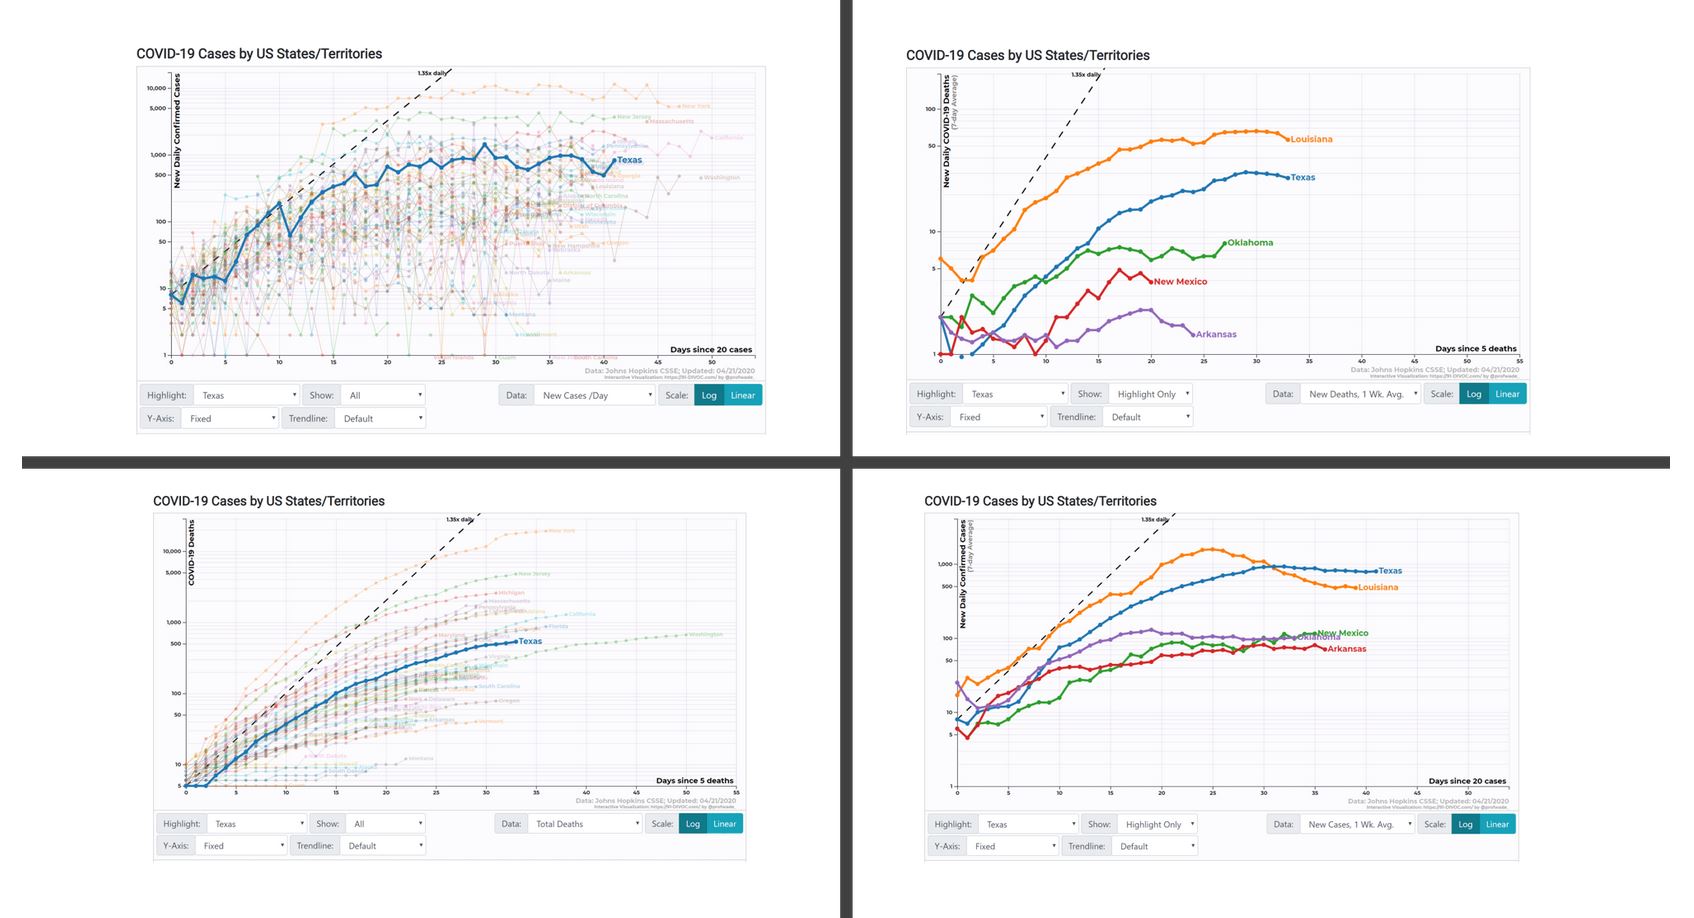
Several 91-DIVOC graphs showing the history of COVID-19 cases in Texas as of April 21, 2020, with various different reader-controlled presentations of the data. In the top-left, the number of new cases per day; top-right, the one-week average of COVID-19 related deaths per 1,000,000 people in Texas and surrounding states; bottom-left, the total COVID-19 related deaths in Texas among all US states and territories; and bottom-right the one-week average of COVID-19 confirmed cases in per 1,000,000 people in Texas and surrounding states.
View more information on 91-DIVOC
ABOUT THE UT DALLAS COMPUTER SCIENCE DEPARTMENT
The UT Dallas Computer Science program is one of the largest Computer Science departments in the United States with over 3,315 bachelors-degree students, more than 1,110 master’s students, 165 Ph.D. students, 52 tenure-track faculty members, and 44 full-time senior lecturers, as of Fall 2019. With The University of Texas at Dallas’ unique history of starting as a graduate institution first, the CS Department is built on a legacy of valuing innovative research and providing advanced training for software engineers and computer scientists.